
Courses
Practical courses in data analysis, statistics, machine learning and AI.
Data Analysis · Intermediate
Python Programming for Data Analysis
Python Programming for Data Analysis is a specialized, hands-on course engineered to transform raw data into actionable insights using one of the most powerful programming languages in the tech industry. Designed for individuals looking to bridge the gap between programming and data-driven strategy, this course focuses immediately on the core Python syntax required to manipulate, clean, and structure data. Participants will quickly move past basic coding concepts to master essential data structures, conditional logic, and functions tailored for data pipelines. By working with real-world datasets from various industries, students will learn to tackle common data challenges, such as handling missing values, filtering records, and merging disparate data sources to prepare them for deep exploration. As the curriculum progresses, students will unlock the full potential of Python’s rich data science ecosystem by diving deep into industry-standard libraries. Participants will gain comprehensive experience with Pandas for high-performance data manipulation, NumPy for advanced numerical computing, and visualization tools like Matplotlib and Seaborn to build compelling, communicative charts. The course goes beyond syntax to teach critical data skills, including exploratory data analysis (EDA), basic statistical modeling, and programmatic trend identification. By the conclusion of this course, students will possess a robust portfolio of data projects and the technical competence required to automate workflows, extract meaningful patterns, and drive evidence-based business decisions.

Programming & Software Development · Intermediate
Python Programming
Python Programming is a comprehensive foundational course designed to introduce students to the essential concepts of software development using one of the world's most popular and versatile programming languages. This course welcomes beginners with no prior coding experience, focusing on building a solid logical mindset and computational thinking skills. Participants will start by mastering core programming concepts, including variable types, conditional logic, loops, and custom functions. Throughout the initial weeks, emphasis is placed on writing clean, readable code and leveraging Python’s massive standard library to automate repetitive tasks, handle files, and solve complex programmatic challenges. As the curriculum advances, students will transition from writing basic scripts to engineering robust, scalable applications. The course dives into fundamental data structures like lists, dictionaries, and tuples, alongside a practical introduction to Object-Oriented Programming (OOP) principles. Beyond the syntax, students will learn essential modern developer workflows, including debugging techniques, error handling, and writing modular code. By the conclusion of the course, participants will possess the practical programming foundation required to specialize in fields such as data science, web development, software engineering, or automation.
Statistics & Biostatistics · Intermediate
Applied Data Analysis for Biostatisticians
Introduction to Biostatistics and Data Analysis is an essential foundational course designed to bridge the gap between biological sciences and data-driven decision-making. This course introduces students to the fundamental principles of statistical reasoning and its direct application to health, medicine, epidemiology, and environmental sciences. Throughout the term, participants will explore the complete lifecycle of quantitative data, beginning with experimental design and proper sampling techniques to minimize bias and sampling error. Students will master descriptive statistics to effectively summarize and present complex health data through numerical metrics, frequency tables, and intuitive graphical visualizations. As the course progresses, the focus shifts to data management, predictive modeling, and inferential statistics, equipping students with the tools to translate raw data into actionable medical evidence. Participants will delve deeply into probability theory, hypothesis testing, confidence intervals, and the critical evaluation of p-values. By learning to select and execute the correct statistical tests—such as t-tests, ANOVA, and regression analysis—students will gain the competencies necessary to draw reliable conclusions about broader populations from localized sample data. Ultimately, this course empowers future researchers and healthcare professionals to rigorously evaluate scientific literature, conduct credible biostatistical studies, and improve human health through evidence-based practice.
Data Analysis · Beginner
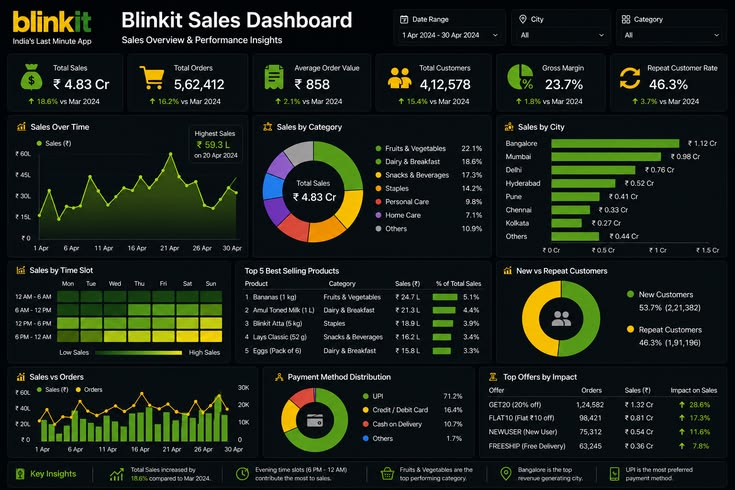
Data Analysis & Visualization
The Data Analysis & Visualization professional certificate course delivers a comprehensive, high-level curriculum designed to transform raw institutional data into clear, strategic corporate intelligence and rigorous research insights. Over this intensive program, participants move methodically through the entire data lifecycle, mastering data ingestion, structured cleaning, and advanced exploratory data analysis (EDA). The first phase focuses heavily on backend data wrangling and statistical compute pipelines, equipping learners with the technical precision required to handle messy enterprise datasets. By combining descriptive statistics, data auditing, and structural formatting, this course builds the core engineering framework necessary to extract high-integrity metrics from complex organizational data pipelines. Engineered specifically for business analysts, research scientists, policy officers, and project managers, this instructor-led program prioritizes impactful, executive-ready communication. Participants discover how to translate complex statistical metrics into compelling visual narratives by creating publication-quality graphics and building dynamic, interactive business intelligence dashboards. The program culminates in an end-to-end data analytics project where learners combine their analytical frameworks, automated workflows, and visual assets into a comprehensive portfolio presentation. Graduates emerge with a robust technical edge and the complete professional autonomy required to drive strategic, data-driven decision-making and eliminate reporting bottlenecks across their organizations.
Data Analysis · Beginner
Excel Pro: Mastering Advanced Functions and Automation
The Excel Pro: Mastering Advanced Functions and Automation course delivers an intensive, enterprise-grade training program designed to transform regular spreadsheet users into high-efficiency data powerhouses. The curriculum strips away basic formatting and introductory math, plunging participants directly into the mechanics of advanced lookup ecosystems like XLOOKUP, INDEX/MATCH, and dynamic array formulas. Over the course of the program, learners master sophisticated logical frameworks, nested conditional statements, and advanced financial and statistical modeling techniques. By engineering robust data architectures within Excel, participants acquire the precision tools necessary to aggregate, audit, and manipulate massive corporate datasets with absolute speed and zero manual errors. Engineered specifically for financial analysts, business operations managers, project leads, and administrative professionals, this instructor-led program bridges the gap between manual reporting and frictionless automation. Students dive deep into the Power Query editor to build automated data cleaning, shaping, and transformation pipelines that refresh with a single click. From there, the course moves into the fundamentals of VBA (Visual Basic for Applications) and macro recording, empowering learners to automate repetitive workflows and build customized user interfaces. Graduates leave this course with a powerful portfolio of automated templates, dynamic executive dashboards, and the technical authority required to eliminate workflow bottlenecks and drive strategic decision-making across their organizations.
Data Analysis · Beginner
R Programming 101: Start Your Data Journey
The R Programming 101: Start Your Data Journey course is an accessible yet rigorous foundational program designed for absolute beginners looking to break into the world of data science. This course strips away the intimidation of coding, guiding participants seamlessly from installing R and RStudio to writing their very first scripts. The first half of the curriculum focuses heavily on programming fundamentals, teaching learners how to navigate core data structures like vectors, matrices, and data frames. By introducing the clean, intuitive philosophy of the Tidyverse ecosystem early on, the course ensures that students skip outdated, frustrating coding habits and immediately learn modern methods to import, filter, and organize raw datasets with confidence. Tailored for aspiring data analysts, research students, and professionals switching careers, this instructor-led program prioritizes practical, hands-on muscle memory over dry theory. Participants do not just read code—they actively build visually stunning, professional-grade charts using ggplot2 and perform fundamental descriptive statistics to uncover stories hidden within data. The course wraps up with a guided mini-project where learners clean a real-world dataset from scratch and generate an automated analytical report. Graduates leave this course with a solid technical foundation, a boost in data literacy, and the momentum needed to progress into advanced statistical modeling and machine learning.
Business Intelligence & Visualization · Beginner
Pizza Sales Data Project – Full Guided Analytics and Modeling Program
The Pizza Sales Data Project – Full Guided Analytics and Modeling Program is a rigorous, immersive case study designed to simulate the full lifecycle of an enterprise data science deployment. Over this intensive program, participants step into the role of a lead data consultant tasked with transforming a chaotic, multi-million-row commercial restaurant dataset into a highly optimized operational strategy. The curriculum bypasses isolated, theoretical exercises, forcing learners to confront the friction of real-world data engineering. Over the first phase, students construct robust data pipelines to ingest transaction logs, handle missing values, and execute complex feature engineering. By applying exploratory data analysis (EDA) alongside rigorous statistical modeling, participants uncover hidden customer behavior patterns, price elasticities, and operational bottlenecks that directly impact a business's bottom line. Engineered specifically for data analysts, business intelligence engineers, and quantitative consultants, this instructor-led program bridges the gap between backend computational modeling and executive-ready business insights. Beyond programming, participants translate their findings into interactive, production-grade dashboards and train predictive models to forecast demand, optimize inventory tracking, and automate menu engineering. The course culminates in a capstone portfolio presentation where learners defend their data models, deployment architectures, and data-driven recommendations against a simulated board of corporate stakeholders. Graduates emerge from this program with a comprehensive, end-to-end analytics project that demonstrates the precise technical authority and commercial acumen demanded by modern data teams.
Data Analysis · Beginner
10-Day SQL for Data Analysis
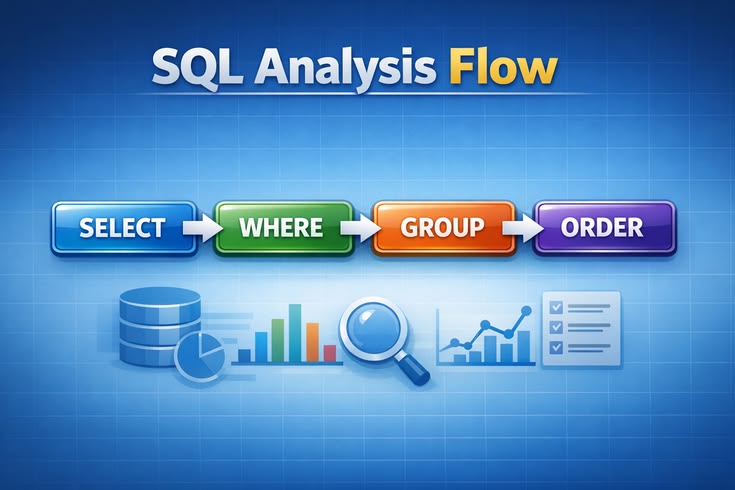
The 10-Day SQL for Data Analysis professional certificate course delivers a comprehensive, high-level curriculum designed to transform raw institutional data into strategic corporate intelligence and rigorous research insights. Over two weeks, participants transition from fundamental relational database concepts and basic SELECT queries to mastering advanced data manipulation techniques. The syllabus methodically navigates the entire data extraction lifecycle—moving from filtering and aggregating records to executing complex multi-table joins, subqueries, and common table expressions (CTEs). By fusing structured query mechanics with logical database architecture, this program equips analytical professionals with the precision tools required to query massive, messy enterprise databases and extract clean, structured datasets for downstream analysis. Engineered specifically for business analysts, database administrators, research scientists, and quantitative project managers, this instructor-led course prioritizes performance optimization and scalable data pipelines. Participants dive deep into advanced analytical capabilities, including window functions for calculating running totals, moving averages, and ranks, as well as optimizing query execution plans for massive data volumes. The final days culminate in an end-to-end data auditing project where learners write complex, production-grade scripts to solve real-world case studies and generate executive-ready performance metrics. Graduates emerge with a robust technical portfolio and the professional autonomy needed to direct sophisticated data retrieval operations and support high-stakes, data-driven decision-making within their organization
Data Analysis · Beginner
10-Day Power BI for Data Analysis
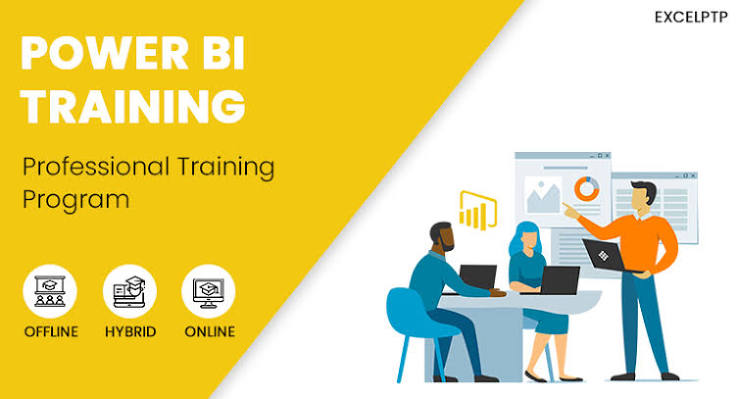
The 10-Day Power BI for Data Analysis program is an intensive, fast-paced roadmap designed to transform beginners into data professionals capable of building production-grade dashboards. Over the course of ten days, participants master the end-to-end data lifecycle, beginning with data ingestion and transformation in Power Query, progressing through data modeling, and unlocking advanced insights using Data Analysis Expressions (DAX). The structured layout ensures a smooth transition from raw, disorganized data sources into a highly optimized, semantic data model. The second half of the program shifts its focus to data storytelling, user experience (UI/UX) design, and enterprise-level sharing. Learners gain hands-on experience building interactive reports with cross-filtering, KPIs, and time-intelligence calculations before publishing their work to the Power BI Service for cloud collaboration. The course culminates in an end-to-end capstone portfolio project that simulates a real-world business intelligence scenario, making it ideal for professionals looking to fast-track their analytics careers or prepare for the PL-300 certification.
Data Analysis · Beginner
10-Day Data Analysis with R
The 10-Day Data Analysis with R professional certificate course delivers a rigorous, high-level curriculum designed to bridge the gap between academic statistical theory and enterprise-level data science. Over two weeks, participants transition from fundamental R syntax and RStudio workspace optimization into mastering the robust Tidyverse ecosystem. The syllabus methodically covers the entire lifecycle of an enterprise data pipeline—from automated data ingestion and complex cleaning to advanced exploratory data analysis (EDA). By combining statistical computing fundamentals with predictive modeling, hypothesis testing, and regression analysis, this program arms analytical professionals with the mathematical and computational tools required to extract objective, high-integrity insights from messy organizational datasets. Engineered specifically for data analysts, institutional researchers, policy officers, and quantitative scientists, this instructor-led course prioritizes scalable, reproducible workflows. Beyond backend statistical programming, learners discover how to translate complex metrics into business intelligence through publication-quality graphics using ggplot2 and dynamic, interactive Shiny dashboards. The final module culminates in an end-to-end data analytics project, requiring participants to compile their scripts, empirical models, and data visualizations into automated, executive-ready Quarto reports. Graduates emerge with a robust technical portfolio and the professional autonomy needed to direct sophisticated data operations and support high-stakes, data-driven decision-making within their organizations.

Data Analysis · Beginner
10 Day Data Analysis for Excel
The 10-Day Data Analysis with Excel Course is designed to equip learners with the essential knowledge and practical skills required to analyze, organize, and interpret data using Microsoft Excel, progressing from beginner to advanced level. Participants will start with the fundamentals of Excel, including workbook and worksheet management, data entry, formatting, cell references, basic formulas, and essential functions such as SUM, AVERAGE, COUNT, IF, and logical functions. The course will then progress to data cleaning and preparation, sorting and filtering, conditional formatting, data validation, text and date functions, lookup functions such as VLOOKUP, XLOOKUP, and INDEX-MATCH, and techniques for handling duplicates, missing values, and inconsistent datasets. By the end of the 10-day training, learners will gain hands-on experience with advanced Excel functions, PivotTables, PivotCharts, data visualization, interactive dashboards, and advanced analytical techniques for transforming raw data into meaningful business insights. The course will also introduce What-If Analysis, scenario analysis, basic forecasting, and the use of Power Query for efficient data transformation and automation. Through practical exercises, real-world datasets, and guided projects, participants will develop the confidence to analyze data, identify trends, generate reports, and support informed decision-making in business, finance, operations, marketing, and other professional fields.
Looking for mentorship or custom training?
Book a Session